চিত্র:Correlation examples2.svg
পরিভ্রমণে চলুন
অনুসন্ধানে চলুন

এই SVG ফাইলের জন্য এই PNG প্রাকদর্শনের আকার: ৫০৬ × ২৩১ পিক্সেল। অন্যান্য আকারসমূহ: ৩২০ × ১৪৬ পিক্সেল | ৬৪০ × ২৯২ পিক্সেল | ১,০২৪ × ৪৬৭ পিক্সেল | ১,২৮০ × ৫৮৪ পিক্সেল | ২,৫৬০ × ১,১৬৯ পিক্সেল।
মূল ফাইল (এসভিজি ফাইল, সাধারণত ৫০৬ × ২৩১ পিক্সেল, ফাইলের আকার: ২.১৮ মেগাবাইট)
সারাংশ
| বিবরণ |
English: redesign File:Correlation_examples.png using vector graphics (SVG file) |
| তারিখ | |
| উৎস | নিজের কাজ, original uploader was Imagecreator |
| লেখক | DenisBoigelot, original uploader was Imagecreator |
| অনুমতি (এ ফাইলের পুনঃব্যবহার) |
Released into the public domain (by the authors). |
| অন্যান্য সংস্করণ |
এই ফাইলের উপজাত কর্মসমূহ: CovrarianceCorrelation.svg File:Correlation_examples.png |
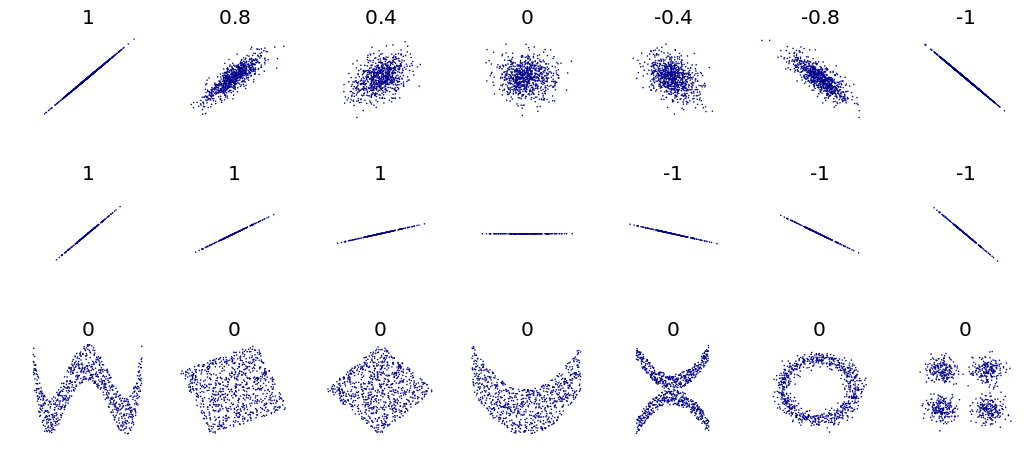
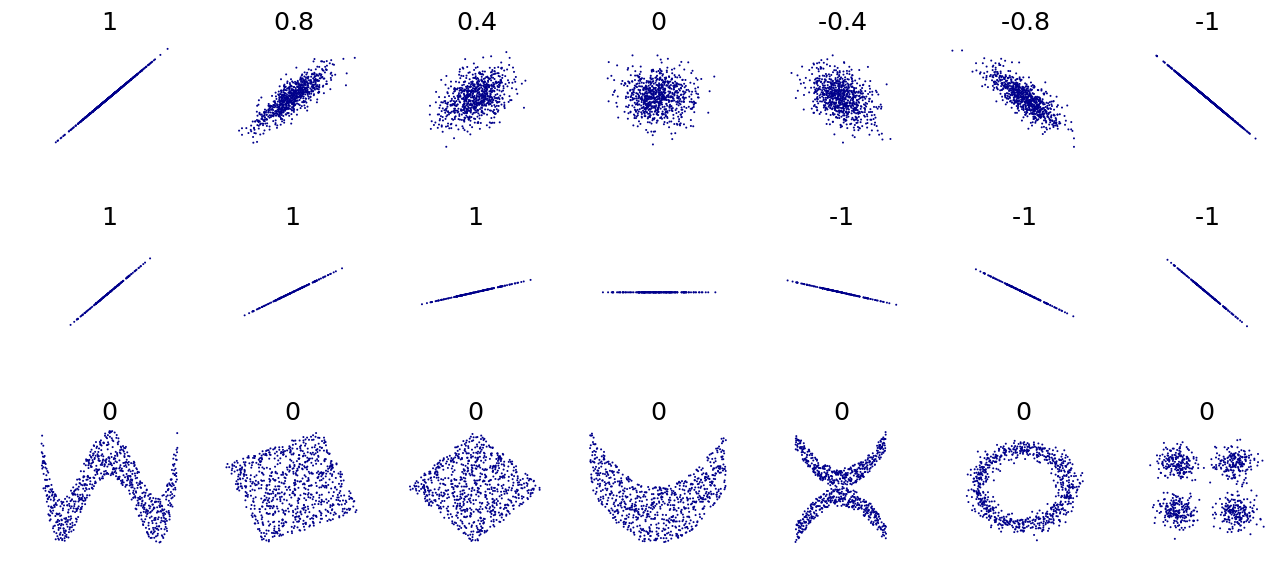
#Title: An example of the correlation of x and y for various distributions of (x,y) pairs
#Tags: Mathematics; Statistics; Correlation
#Author: Denis Boigelot
#Packets needed : mvtnorm (rmvnorm), RSVGTipsDevice (devSVGTips)
#How to use: output()
#
#This is an translated version in R of an Matematica 6 code by Imagecreator.

library(mvtnorm)
library(RSVGTipsDevice)

MyPlot <- function(xy, xlim = c(-4, 4), ylim = c(-4, 4), eps = 1e-15) {
   title = round(cor(xy[,1], xy[,2]), 1)
   if (sd(xy[,2]) < eps) title = "" # corr. coeff. is undefined
   plot(xy, main = title, xlab = "", ylab = "",
        col = "darkblue", pch = 16, cex = 0.2,
        xaxt = "n", yaxt = "n", bty = "n",
        xlim = xlim, ylim = ylim)
}

MvNormal <- function(n = 1000, cor = 0.8) {
   for (i in cor) {
      sd = matrix(c(1, i, i, 1), ncol = 2)
      x = rmvnorm(n, c(0, 0), sd)
      MyPlot(x)
   }
}

rotation <- function(t, X) return(X %*% matrix(c(cos(t), sin(t), -sin(t), cos(t)), ncol = 2))

RotNormal <- function(n = 1000, t = pi/2) {
   sd = matrix(c(1, 1, 1, 1), ncol = 2)
   x = rmvnorm(n, c(0, 0), sd)
   for (i in t)
      MyPlot(rotation(i, x))
}

Others <- function(n = 1000) {
   x = runif(n, -1, 1)
   y = 4 * (x^2 - 1/2)^2 + runif(n, -1, 1)/3
   MyPlot(cbind(x,y), xlim = c(-1, 1), ylim = c(-1/3, 1+1/3))

   y = runif(n, -1, 1)
   xy = rotation(-pi/8, cbind(x,y))
   lim = sqrt(2+sqrt(2)) / sqrt(2)
   MyPlot(xy, xlim = c(-lim, lim), ylim = c(-lim, lim))

   xy = rotation(-pi/8, xy)
   MyPlot(xy, xlim = c(-sqrt(2), sqrt(2)), ylim = c(-sqrt(2), sqrt(2)))

   y = 2*x^2 + runif(n, -1, 1)
   MyPlot(cbind(x,y), xlim = c(-1, 1), ylim = c(-1, 3))

   y = (x^2 + runif(n, 0, 1/2)) * sample(seq(-1, 1, 2), n, replace = TRUE)
   MyPlot(cbind(x,y), xlim = c(-1.5, 1.5), ylim = c(-1.5, 1.5))

   y = cos(x*pi) + rnorm(n, 0, 1/8)
   x = sin(x*pi) + rnorm(n, 0, 1/8)
   MyPlot(cbind(x,y), xlim = c(-1.5, 1.5), ylim = c(-1.5, 1.5))

   xy1 = rmvnorm(n/4, c( 3,  3))
   xy2 = rmvnorm(n/4, c(-3,  3))
   xy3 = rmvnorm(n/4, c(-3, -3))
   xy4 = rmvnorm(n/4, c( 3, -3))
   MyPlot(rbind(xy1, xy2, xy3, xy4), xlim = c(-3-4, 3+4), ylim = c(-3-4, 3+4))
}

output <- function() {
   devSVGTips(width = 7, height = 3.2) # remove first and last line for no svg exporting
   par(mfrow = c(3, 7), oma = c(0,0,0,0), mar=c(2,2,2,0))
   MvNormal(800, c(1.0, 0.8, 0.4, 0.0, -0.4, -0.8, -1.0));
   RotNormal(200, c(0, pi/12, pi/6, pi/4, pi/2-pi/6, pi/2-pi/12, pi/2));
   Others(800)
   dev.off() # remove first and last line for no svg exporting
}
লাইসেন্স প্রদান
আমি, এই কাজের স্বত্বাধিকারী, এতদ্দ্বারা আমি এই কাজকে নিম্ন বর্ণিত লাইসেন্সের আওতায় প্রকাশ করলাম:
| এই ফাইলটি ক্রিয়েটিভ কমন্স সিসি০ ১.০ সার্বজনীন পাবলিক ডোমেইন উৎসর্গীকরণের আওতায় রয়েছে। | |
| যেই ব্যক্তিটি এই কাজটির সাথে সংশ্লিষ্ট তিনি এই কাজটি পাবলিক ডোমেইনে মুক্ত করার মাধ্যমে তাঁর সকল স্বত্ত্ব বিশ্বের সকল কপিরাইট আইনের আওতায় ত্যাগ করেছেন। যার মধ্যে নেইবারিং অধিকার, ও আইনের মাধ্যমে এক্সটেন্টও অন্তর্গত। আপনি এই কাজটি কোন অনুমতি চাওয়া ছাড়াই মুক্তভাবে অনুলিপি, পরিবর্তন, বিতরণ করতে পারেন, এবং এমন কি কোনো বাণিজ্যিক কাজেও ব্যবহার করতে পারেন।
|
ফাইলের ইতিহাস
যেকোনো তারিখ/সময়ে ক্লিক করে দেখুন ফাইলটি তখন কী অবস্থায় ছিল।
| তারিখ/সময় | সংক্ষেপচিত্র | মাত্রা | ব্যবহারকারী | মন্তব্য | |
|---|---|---|---|---|---|
| বর্তমান | ০৭:০০, ১০ মে ২০১১ | | ৫০৬ × ২৩১ (২.১৮ মেগাবাইট) | wikimediacommons>DenisBoigelot | {{Information |Description ={{en|1=fd}} |Source ={{own}} |Author =DenisBoigelot |Date = |Permission = |other_versions = }} fjdk |
ফাইলের ব্যবহার
নিম্নলিখিত পাতাটি এই ফাইল ব্যবহার করে: