চিত্র:Prime number theorem ratio convergence.svg
পরিভ্রমণে চলুন
অনুসন্ধানে চলুন

এই SVG ফাইলের জন্য এই PNG প্রাকদর্শনের আকার: ২৫০ × ১৬০ পিক্সেল। অন্যান্য আকারসমূহ: ৩২০ × ২০৫ পিক্সেল | ৬৪০ × ৪১০ পিক্সেল | ১,০২৪ × ৬৫৫ পিক্সেল | ১,২৮০ × ৮১৯ পিক্সেল | ২,৫৬০ × ১,৬৩৮ পিক্সেল।
মূল ফাইল (এসভিজি ফাইল, সাধারণত ২৫০ × ১৬০ পিক্সেল, ফাইলের আকার: ৮৭ কিলোবাইট)
সারাংশ
| বিবরণ |
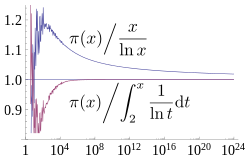
English: A plot showing how two estimates described by the prime number theorem, and converge asymptotically towards , the number of primes less than x. The x axis is and is logarithmic (labelled in evenly spaced powers of 10), going up to 1024, the largest for which is currently known. The former estimate converges extremely slowly, while the latter has visually converged on this plot by 108. Source used to generate this chart is shown below. |
| তারিখ | |
| উৎস | নিজের কাজ |
| লেখক | Dcoetzee |
| SVG genesis |


লাইসেন্স প্রদান
আমি, এই কাজের স্বত্বাধিকারী, এতদ্দ্বারা আমি এই কাজকে নিম্ন বর্ণিত লাইসেন্সের আওতায় প্রকাশ করলাম:
| এই ফাইলটি ক্রিয়েটিভ কমন্স সিসি০ ১.০ সার্বজনীন পাবলিক ডোমেইন উৎসর্গীকরণের আওতায় রয়েছে। | |
| যেই ব্যক্তিটি এই কাজটির সাথে সংশ্লিষ্ট তিনি এই কাজটি পাবলিক ডোমেইনে মুক্ত করার মাধ্যমে তাঁর সকল স্বত্ত্ব বিশ্বের সকল কপিরাইট আইনের আওতায় ত্যাগ করেছেন। যার মধ্যে নেইবারিং অধিকার, ও আইনের মাধ্যমে এক্সটেন্টও অন্তর্গত। আপনি এই কাজটি কোন অনুমতি চাওয়া ছাড়াই মুক্তভাবে অনুলিপি, পরিবর্তন, বিতরণ করতে পারেন, এবং এমন কি কোনো বাণিজ্যিক কাজেও ব্যবহার করতে পারেন।
|
Source
All source released under CC0 waiver.
Mathematica source to generate graph (which was then saved as SVG from Mathematica):
(* Sample both functions at 600 logarithmically spaced points between \
1 and 2^40 *)
base = N[E^(24 Log[10]/600)];
ratios = Table[{Round[base^x],
    N[PrimePi[Round[base^x]]/(base^x/(x*Log[base]))]}, {x, 1,
    Floor[40/Log[2, base]]}];
ratiosli =
  Table[{Round[base^x],
    N[PrimePi[
       Round[base^x]]/(LogIntegral[base^x] - LogIntegral[2])]}, {x,
    Ceiling[Log[base, 2]], Floor[40/Log[2, base]]}];
(* Supplement with larger known PrimePi values that are too large for \
Mathematica to compute *)
LargePiPrime = {{10^13, 346065536839}, {10^14, 3204941750802}, {10^15,
     29844570422669}, {10^16, 279238341033925}, {10^17,
    2623557157654233}, {10^18, 24739954287740860}, {10^19,
    234057667276344607}, {10^20, 2220819602560918840}, {10^21,
    21127269486018731928}, {10^22, 201467286689315906290}, {10^23,
    1925320391606803968923}, {10^24, 18435599767349200867866}};
ratios2 =
  Join[ratios,
   Map[{#[[1]], N[#[[2]]]/(#[[1]]/(Log[#[[1]]]))} &, LargePiPrime]];
ratiosli2 =
  Join[ratiosli,
   Map[{#[[1]], N[#[[2]]]/(LogIntegral[#[[1]]] - LogIntegral[2])} &,
    LargePiPrime]];
(* Plot with log x axis, together with the horizontal line y=1 *)
Show[LogLinearPlot[1, {x, 1, 10^24}, PlotRange -> {0.8, 1.25}],
 ListLogLinearPlot[{ratios2, ratiosli2}, Joined -> True],
 LabelStyle -> FontSize -> 14]
LaTeX source for labels:
$$ \left.{\pi(x)}\middle/{\frac{x}{\ln x}}\right. $$
$$ \left.{\pi(x)}\middle/{\int_2^x \frac{1}{\ln t} \mathrm{d}t}\right. $$
These were converted to SVG with [1] and then the graph was embedded into the resulting document in Inkscape. Axis fonts were also converted to Liberation Serif in Inkscape.
ফাইলের ইতিহাস
যেকোনো তারিখ/সময়ে ক্লিক করে দেখুন ফাইলটি তখন কী অবস্থায় ছিল।
| তারিখ/সময় | সংক্ষেপচিত্র | মাত্রা | ব্যবহারকারী | মন্তব্য | |
|---|---|---|---|---|---|
| বর্তমান | ১৪:০৭, ২১ মার্চ ২০১৩ | | ২৫০ × ১৬০ (৮৭ কিলোবাইট) | wikimediacommons>Dcoetzee | Change n to x to match article |
ফাইলের ব্যবহার
নিম্নলিখিত 3টি পাতা এই ফাইল ব্যবহার করে: